Chart Patterns
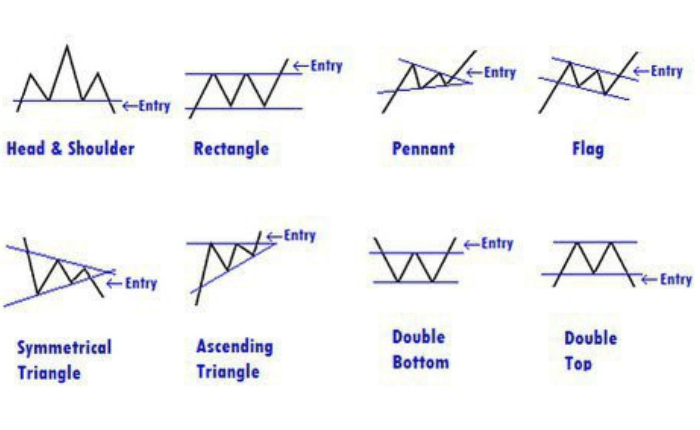
Here’s the list of chart patterns that we’re going to cover:
•Double Top and Double Bottom
•Head and Shoulders and Inverse Head and Shoulders
•Rising and Falling Wedges
•Bullish and Bearish Rectangles
•Bearish and Bullish Pennants
•Triangles (Symmetrical, Ascending, and Descending)
Double Top
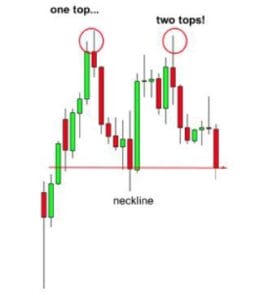
A double top is a reversal pattern that is formed after there is an extended move-up. The “tops” are peaks that are formed when the price hits a certain level that can’t be broken. After hitting this level, the price will bounce off it slightly, but then return back to test the level again. If the price bounces off of that level again, then you have a DOUBLE top!
Double Bottom
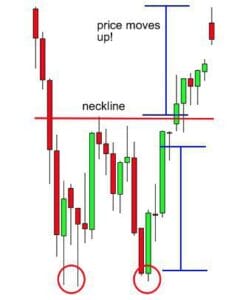
The double bottom is also a trend reversal formation, but this time we are looking to go long instead of short.
These formations occur after extended downtrends when two valleys or “bottoms” have been formed. Remember, just like double tops, and double bottoms they are also trend-reversal formations.
You’ll want to look for these after a strong downtrend.